A/B Testing: The Data-Driven Guide to Better Conversions
Every week, marketing teams ship landing pages, email campaigns, and product changes based on intuition. Most of those decisions cost money. A/B testing replaces guesswork with evidence, letting you measure the actual impact of each change before committing resources. Yet most guides on the topic either oversimplify (“just test button colors”) or drown readers in academic statistics. This guide bridges that gap with a practical methodology, real decision frameworks, and the statistical literacy you need to run valid experiments in 2026.
What Is A/B Testing?
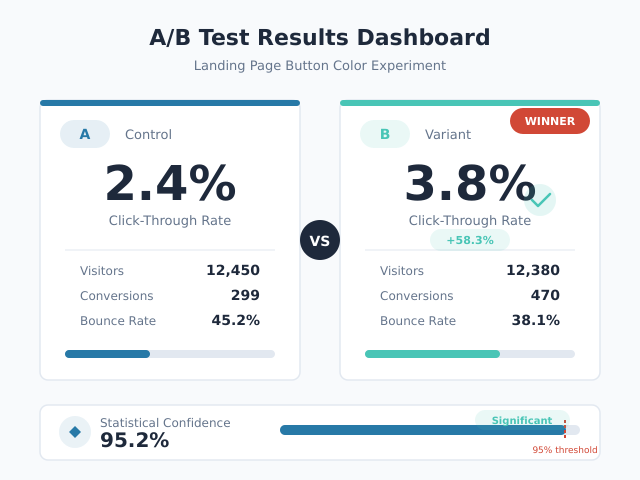
A/B testing (also called split testing) is a controlled experiment that compares two versions of something — a webpage, email, ad, or product feature — to determine which performs better. You randomly split your audience into two groups: Group A sees the original (control), and Group B sees the variation (treatment). Then you measure which version produces a better outcome against your chosen metric.
The key word is controlled. Unlike before-and-after comparisons, A/B tests run both versions simultaneously. This eliminates confounding variables like seasonality, day-of-week effects, and traffic fluctuations that make sequential comparisons unreliable.
A/B Testing vs. Multivariate Testing
A/B testing compares two distinct versions. Multivariate testing (MVT) tests multiple variables and their combinations simultaneously. For example, an MVT might test three headlines and two hero images — six combinations total.
| Feature | A/B Test | Multivariate Test |
|---|---|---|
| Versions tested | 2 (control vs. variation) | Multiple combinations |
| Traffic required | Moderate | High (grows exponentially) |
| Best for | Single changes, clear hypotheses | Optimizing multiple elements together |
| Complexity | Low | High |
| Time to significance | Days to weeks | Weeks to months |
In practice, most teams should start with A/B tests. Multivariate testing demands substantially more traffic. A page with 10,000 monthly visitors can support an A/B test but would need months to reach significance in a multivariate experiment.
The A/B Testing Process
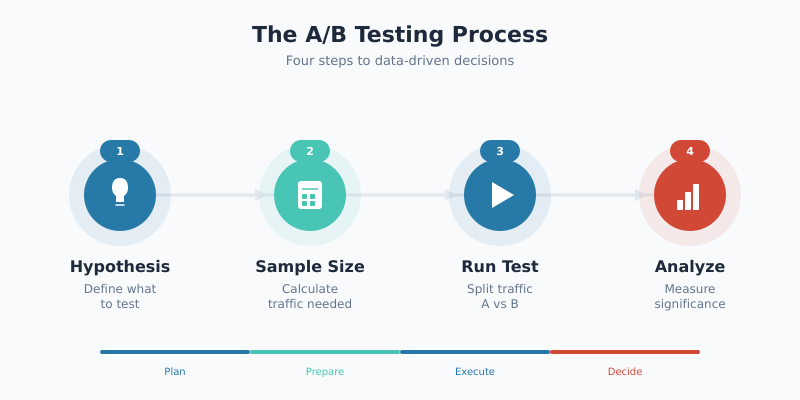
Successful experiments follow a structured four-step process. Skipping steps — especially hypothesis formation and sample size calculation — is the most common reason tests produce misleading results.
Form Your Hypothesis
Every test starts with a hypothesis, not an idea. A proper hypothesis follows this structure:
“Changing [specific element] from [current state] to [new state] will [increase/decrease] [metric] because [reasoning based on data or user research].”
For example: “Changing the CTA button text from ‘Submit’ to ‘Get My Free Report’ will increase form completions by 15% because user session recordings show visitors hesitating at the generic submit button.”
Notice the hypothesis includes a specific metric and a rationale grounded in data. “Let’s test a green button” is not a hypothesis. Without a clear reason and expected outcome, you cannot distinguish a meaningful result from random noise.
Calculate Sample Size Before You Start
Determine your required sample size before launching the test. This step prevents the two most common mistakes: stopping too early and running too long. The formula depends on four inputs:
- Baseline conversion rate — your current performance (e.g., 3.2%)
- Minimum detectable effect (MDE) — the smallest improvement worth detecting (e.g., 10% relative lift)
- Statistical significance level — typically 95% (alpha = 0.05)
- Statistical power — typically 80% (beta = 0.20)
For a baseline conversion rate of 3.2% and a 10% relative MDE (detecting a lift from 3.2% to 3.52%), you need approximately 75,000 visitors per variation. Use our statistical significance calculator to compute the exact number for your scenario.
Run the Test
Once launched, follow three critical rules:
- Do not peek at results before the planned duration ends. Early peeking inflates false positive rates dramatically (more on this below).
- Run for at least one full business cycle — typically 7 days minimum — to capture day-of-week variation.
- Monitor for technical issues only. Check that both versions load correctly and that traffic splits remain even, but do not evaluate performance until the test concludes.
Analyze Results
When your test reaches the pre-calculated sample size, analyze the data. Look at three things:
- Statistical significance: Did the result reach your threshold (typically p < 0.05)?
- Practical significance: Is the measured effect large enough to matter for your business?
- Sample Ratio Mismatch (SRM): Was the traffic split actually 50/50?
A test can be statistically significant but practically meaningless. If your variation wins by 0.02 percentage points, the engineering effort to implement it likely exceeds the revenue gain. Always calculate the expected business impact before declaring a winner.
Statistical Significance in A/B Testing Explained
Statistical significance answers one question: “Is this result likely real, or could it be random chance?” Understanding this concept prevents both false confidence in flukes and premature abandonment of real improvements.
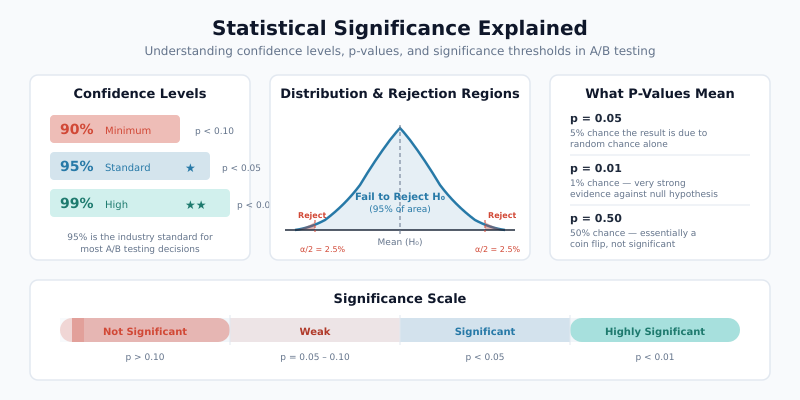
Confidence Levels and P-Values
A p-value measures the probability of observing your result (or a more extreme one) if there were truly no difference between versions. A p-value of 0.03 means there is a 3% chance the observed difference arose from random variation alone.
The confidence level equals 1 minus the significance level. At 95% confidence (alpha = 0.05), you accept a 5% chance of a false positive. Industry standard uses 95%, though some teams use 90% for exploratory tests or 99% for high-stakes changes.
| Confidence Level | False Positive Rate | When to Use |
|---|---|---|
| 90% | 10% | Exploratory tests, low-risk changes |
| 95% | 5% | Standard for most experiments |
| 99% | 1% | High-stakes decisions, pricing changes |
Practical Significance vs. Statistical Significance
These are different concepts that teams frequently conflate. Statistical significance means the result is unlikely to be random. Practical significance means the result is large enough to justify action.
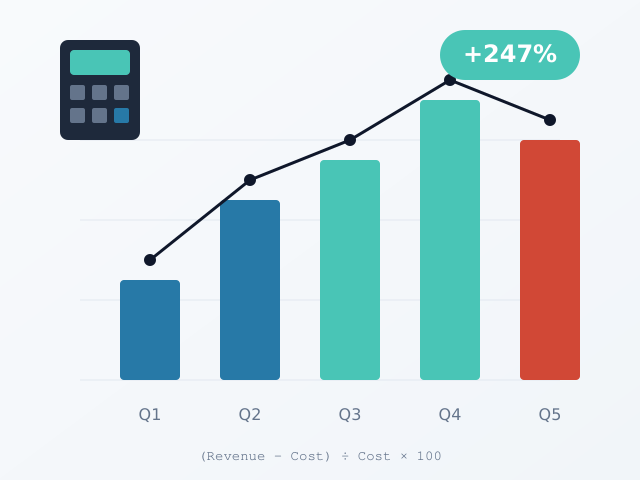
Consider a test where Version B increases conversion rate from 4.00% to 4.05% with p = 0.02. The result is statistically significant. However, that 0.05 percentage point increase might generate only $200 in additional monthly revenue — not enough to justify the development cost of implementing the change. Use our ROI calculator to quantify the expected business impact before making implementation decisions.
What to Test: A Priority Framework
Not all tests are equally valuable. The ICE framework (Impact, Confidence, Ease) helps prioritize your testing backlog. Score each potential test from 1-10 on three dimensions, then average the scores.
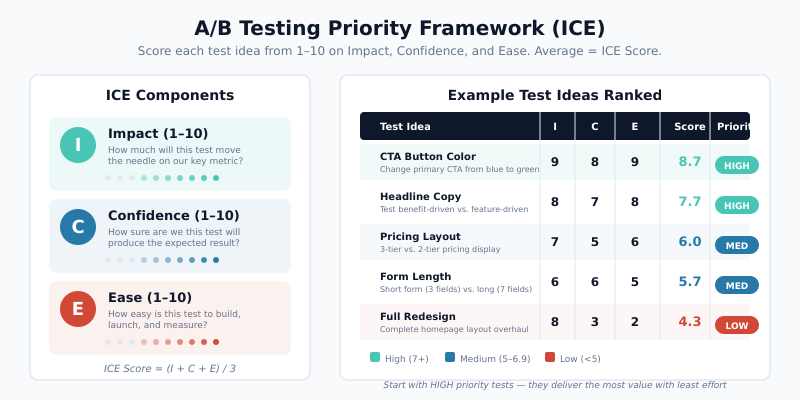
| Test Idea | Impact (1-10) | Confidence (1-10) | Ease (1-10) | ICE Score |
|---|---|---|---|---|
| Simplify checkout form (remove 3 fields) | 9 | 8 | 7 | 8.0 |
| Add trust badges above CTA | 6 | 7 | 9 | 7.3 |
| Change headline copy | 7 | 5 | 9 | 7.0 |
| Redesign pricing page layout | 9 | 6 | 3 | 6.0 |
| Change button color | 2 | 3 | 10 | 5.0 |
Notice that button color — the stereotypical A/B test — scores lowest. Structural changes to user flows, value propositions, and friction points consistently outperform cosmetic tweaks. Focus your testing energy on elements closest to the conversion decision.
High-Impact A/B Testing Elements
Based on research from the CXL Institute, these elements typically produce the largest measurable effects:
- Headlines and value propositions: What you promise matters more than how the page looks
- Form length and fields: Every additional field reduces completion rates by 4-7%
- Social proof placement: Testimonials, customer counts, and trust signals near conversion points
- Pricing presentation: Annual vs. monthly framing, anchor pricing, plan names
- Page structure: Information hierarchy, content order, navigation patterns
Common A/B Testing Mistakes
Even experienced teams make errors that invalidate results. Here are the most damaging mistakes and how to avoid them.
| Mistake | Why It’s Harmful | How to Fix |
|---|---|---|
| Stopping tests early when results look good | Inflates false positive rate to 20-30% | Pre-calculate sample size; commit to the plan |
| Peeking at results during the test | Multiple comparisons problem inflates error rates | Use sequential testing methods or wait for full sample |
| Ignoring Sample Ratio Mismatch (SRM) | Uneven traffic splits indicate bugs that bias results | Run a chi-squared test on traffic allocation before analyzing outcomes |
| Testing too many variations at once | Splits traffic too thin, extends test duration dramatically | Limit to 2-3 variations per test |
| No hypothesis before testing | Leads to random changes with no learning | Document hypothesis, metric, and expected effect before launch |
| Ignoring novelty effects | New designs get short-term attention that fades | Run tests for 2-4 weeks; re-check results after the novelty period |
| Testing during anomalous periods | Holiday traffic, promotions, or outages skew data | Avoid tests during sales events; exclude anomalous data |
The Peeking Problem Explained
The peeking problem deserves special attention because it is both common and devastating. When you check your test results daily and plan to stop as soon as significance appears, your actual false positive rate skyrockets. Research by Evan Miller demonstrated that peeking at results after every 100 new users increases the false positive rate from the intended 5% to over 26%.
Two solutions exist. First, you can commit to a fixed sample size and only analyze once, at the end. Second, you can use sequential testing methods (like the always-valid p-value approach) that are specifically designed for continuous monitoring. Many modern testing platforms now offer sequential testing as a built-in option.
Sample Ratio Mismatch (SRM)
SRM occurs when the observed traffic split deviates significantly from the intended split. If you configured a 50/50 split but observe 51.2% vs. 48.8% among 100,000 visitors, that difference is statistically significant and indicates a problem.
Common SRM causes include browser redirects affecting only one variant, bot traffic disproportionately hitting one version, or assignment logic bugs. Always check for SRM before trusting your test results. If SRM exists, discard the data and fix the technical issue.
A/B Test Duration and Sample Size Rules
Test duration depends on traffic volume, baseline conversion rate, and the minimum effect you want to detect. Here are practical rules for planning.
The Minimum Duration Rule
Never run a test for fewer than 7 days, regardless of sample size. Weekend behavior differs from weekday behavior. Additionally, many users visit a site multiple times per week, so short tests risk counting the same users in both variants.
Sample Size Estimation in Practice
The required sample size grows as baseline conversion rates drop and as you try to detect smaller effects. This table shows approximate visitors needed per variation at 95% confidence and 80% power:
| Baseline Rate | 5% Relative MDE | 10% Relative MDE | 20% Relative MDE |
|---|---|---|---|
| 1% | 3,200,000 | 800,000 | 200,000 |
| 3% | 1,060,000 | 265,000 | 66,000 |
| 5% | 620,000 | 155,000 | 39,000 |
| 10% | 290,000 | 72,000 | 18,000 |
| 20% | 128,000 | 32,000 | 8,000 |
These numbers explain why low-traffic sites struggle with A/B testing. A site with 1,000 daily visitors testing a 3% conversion rate for a 10% relative lift needs 265 days per variation — clearly impractical. In such cases, test larger changes (higher MDE) or focus on qualitative research instead.
When to Stop a Test
Follow this decision framework:
- Has the test reached the pre-calculated sample size? If no, keep running.
- Has it run for at least 7 days? If no, keep running.
- Is there a Sample Ratio Mismatch? If yes, investigate the technical issue before analyzing.
- Is the result statistically significant (p < 0.05)? If yes, evaluate practical significance. If no, the test is inconclusive — not a loss for the control.
An inconclusive result is still a result. It means the change you tested does not produce a measurable effect at the sensitivity level you chose. Document it and move to the next hypothesis.
A/B Testing in 2026: What Has Changed
The experimentation landscape has shifted significantly. Three trends define modern A/B testing practice.
Server-Side Testing
Client-side testing — injecting JavaScript to modify pages in the browser — is giving way to server-side testing. In server-side implementations, the variation logic runs on your server before the page renders. This eliminates the flicker effect (where users briefly see the original before the variant loads) and enables testing of complex backend logic like pricing algorithms, recommendation engines, and checkout flows.
Server-side testing also provides more reliable data. Client-side tests can be blocked by ad blockers, fail on slow connections, or produce inconsistent experiences across devices. Server-side delivery avoids these issues entirely.
Privacy-First Testing Without Cookies
With third-party cookie deprecation and stricter privacy regulations like GDPR and ePrivacy, A/B testing tools have adapted. Modern approaches include:
- First-party data assignment: Using server-side session management instead of cookies for variant assignment
- Edge-based personalization: Running experiments at the CDN edge (Cloudflare Workers, Vercel Edge Functions) with encrypted identifiers
- Consent-aware experimentation: Adapting test assignment based on user consent status
- Cookieless fingerprinting alternatives: Using deterministic hashing of non-PII attributes for consistent assignment
These methods maintain experiment validity while respecting user privacy. The shift requires closer collaboration between engineering and optimization teams.
Feature Flags and Experimentation Platforms
Feature flags — toggles that enable or disable functionality without deploying new code — have merged with experimentation. Platforms like Eppo and LaunchDarkly combine feature management with statistical analysis, letting teams run experiments on any product change.
This convergence means A/B testing is no longer limited to marketing pages. Product teams now experiment on onboarding flows, algorithm parameters, notification timing, and infrastructure changes. The methodology remains the same: hypothesis, controlled experiment, statistical analysis.
Essential A/B Testing Tools
The right toolset depends on your team’s technical resources and testing volume.
Statistical Significance Calculators
Before investing in a full platform, you need a reliable way to calculate significance. Our A/B test significance calculator handles the math for both conversion rate and revenue-per-visitor tests. Input your sample sizes and conversion counts to get an immediate significance assessment.
Campaign Tracking for A/B Tests
Proper attribution matters when running A/B tests across marketing channels. Use UTM parameters to tag traffic sources feeding into your experiment. This helps you segment results by channel and identify whether a variant performs differently across organic, paid, and email traffic.
Full A/B Testing Platforms
For teams running multiple concurrent experiments, consider dedicated platforms:
- VWO: Visual editor plus server-side testing, good for marketing teams
- Optimizely: Enterprise-grade feature experimentation with robust statistical engine
- Eppo: Warehouse-native experimentation for data-driven teams
- PostHog: Open-source product analytics with built-in experimentation
Regardless of which platform you choose, the statistical principles in this guide apply universally. A tool cannot fix a flawed experiment design.
Bottom Line
A/B testing is the most reliable method for making evidence-based optimization decisions. The methodology is straightforward: form a hypothesis, calculate sample size, run the experiment without peeking, and analyze results with both statistical and practical significance in mind.
Most testing failures stem from process errors, not statistical complexity. Pre-calculate your sample size. Commit to the test duration. Check for Sample Ratio Mismatch. Document every experiment — winners, losers, and inconclusive results alike.
Start with high-impact elements like value propositions and form friction rather than cosmetic changes. As your testing program matures, expand into server-side experimentation and feature flags. The organizations that build a disciplined testing culture consistently outperform those relying on intuition — and the data proves it.